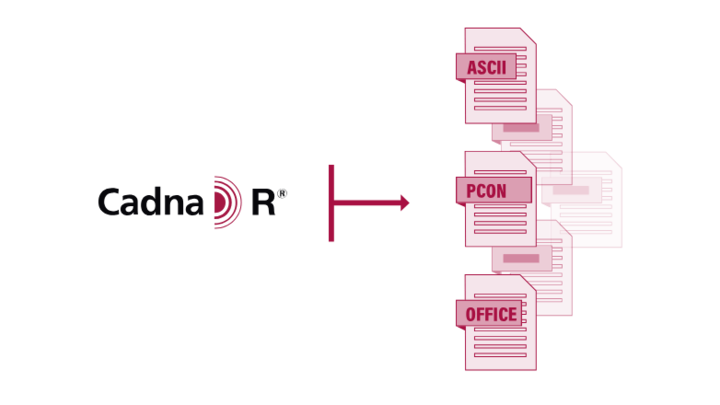
Visual and aural presentation

CadnaR offers many ways of displaying calculated data and thus makes your result presentation very flexible. In fact, many users make engaging presentations of results directly in CadnaR to customers, so they would be able to discuss noise reduction measures and even making further modifications in real time. 


Dynamic 3D

CadnaR features a powerful, OpenGL based 3D view, which serves several purposes: use it to quickly check your model, or for changing objects due to the direct access to them which you also have in 3D mode or use it for presenting results to customers. With the Dynamic 3D you will be able to:

  • Include 3D Symbols* such as furniture, decoration or people, to present mitigation measures and their visual effects to third parties.
  • Video recording*: The Dynamic 3D allows in real-time to drive through or even fly over your project model. It is also possible to define a path and record a video in AVI format for any tour. It is even possible to generate animated 3D Noise** or Quality Criteria Maps*** for moving sources.
  • Stereoscopic 3D: CadnaR can display 3D-Special views as Stereo images on external 3D-TV sets or monitors.

*    Option VIS required
**  Option VIS and ORG required
*** Option VIS, ORG and AUDIO required

Auralisation*

Make your rooms audible not only to yourself, but also to anyone with less acoustic expertise. Listen to your room with and without acoustic optimization to make anyone understand in an intuitive way the benefits of the acoustic measures. The auralization itself comes with an easy to use interface. Once your energetic impulse response has been calculated, just select the Audio file (*.wav) you want to listen to, select the receiver position and press “calculate” to generate an audio file which sounds like it has been played in your room. You can even directly compare different variants or scenarios of your project.

*   Option AUDIO required

PlotDesigner

With the PlotDesigner, arbitrary print-outs can be designed in a flexible and user-friendly way. No matter whether you start from scratch or use any predefined template, you will be able to arrange any view, grid map and detail of your project ready for printing. As an example, you may display the plan view of your project including a noise map (with several active machines) or a STI-map (speaking person in an office) besides several 3D-Special-views. In case you recalculate or modify the project, the plot will automatically be updated including any further existing variants.

Export formats

CadnaR can export full reports to Ms Office suite (.docx and .xlsx formats).

Grid results can be also exported to ASCII format*.  Voxel grids can be exported in a 3D format* which can be imported directly by the pCon.planner for presentation purposes.

* Option CALC required

Automatically generated tables and diagrams

CadnaR provides many automatically generated tables and diagrams. On the one hand they allow you to get deeper understanding of the acoustic situation at hand. On the other hand, they present any results you need for further analysis or your report in a clear and intuitive way.

  • Echograms*: They show the energetic impulse response and the backward-integrated sound decay curve at the receiver position in each octave band. With one glance you can see if the decay curve is linear, which means diffuse conditions, or curved, which means that the diffuse field conditions are not met, and the reverberation time may be of limited meaningfulness.
  • Reverberation times*: Reverberation times can be displayed as table or diagram for each individual receiver or for all active receiver in the room (as spatially averaged reverberation time). In the diagrams, you can choose if you want to display EDT, T10, T20 or T30. In case of the diagrams for the spatially averaged reverberation times there is even the possibility do directly compare the reverberation times of different scenarios of your project and also include measured reverberation times in the comparison.
  • Spatial decay curves*: The receiver chains provide the spatial decay rates and the level diagram showing the spatial decay of the sound pressure level along the path. In case of a speaking person the STI-diagram* visualize the distraction radius and the privacy radius.